Why More Text is (Often) Better: Themes from Reader Preferences for Integration of Charts and Text

Chase Stokes, Marti Hearst

View presentation:2022-10-16T19:55:00ZGMT-0600Change your timezone on the schedule page
2022-10-16T19:55:00Z
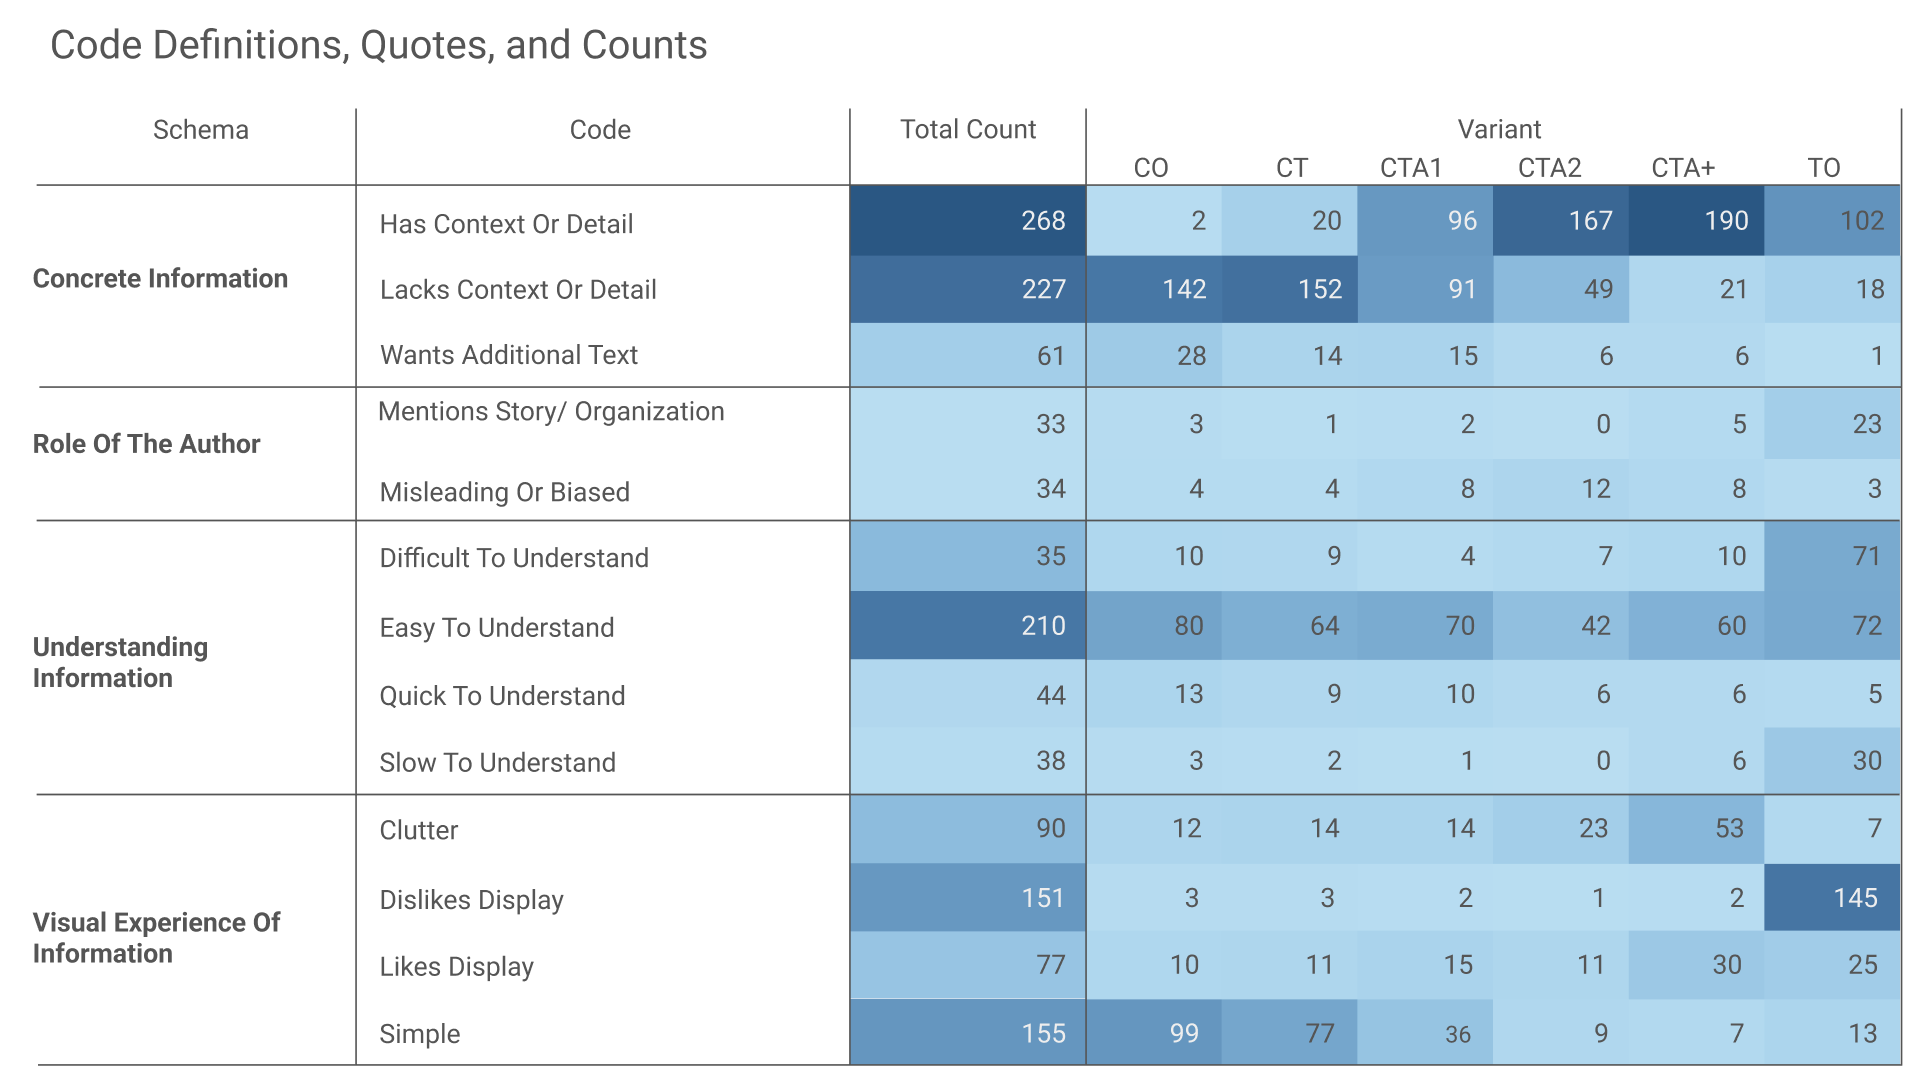
Exemplar figure, described by caption below
Key codes for the creation of the three main themes are listed. Schema refers to the broader classifications of codes, which were used to create the themes. The total count of participants who mentioned a code at least once is shown, followed by a breakdown of these counts by stimulus variant. The darker the shade of blue, the higher the count. Not all participants who mentioned a code did so for all variants; some did so for more than one variant. Six stimuli were examined in this study, with varying amounts of text: Chart-Only (CO), Chart-Title (CT), Chart-Title-Annotation-1 (CTA1), Chart-Title-Annotation-2 (CTA2), Chart-Title-Annotation+ (CTA+), and Text-Only (TO).

The live footage of the talk, including the Q&A, can be viewed on the session page, NLVIZ: Opening, Keynote and Paper Session I.

Abstract