SD^2: Slicing and Dicing Scholarly Data for Interactive Evaluation of Academic Performance
Zhichun Guo, Jun Tao, Siming Chen, Nitesh V. Chawla, Chaoli Wang
View presentation:2022-10-20T19:24:00ZGMT-0600Change your timezone on the schedule page
2022-10-20T19:24:00Z

Prerecorded Talk
The live footage of the talk, including the Q&A, can be viewed on the session page, Reflecting on Academia and our Field.
Fast forward
Keywords
Scholarly performance, publication, citation, hierarchical histogram, visual analytics.
Abstract
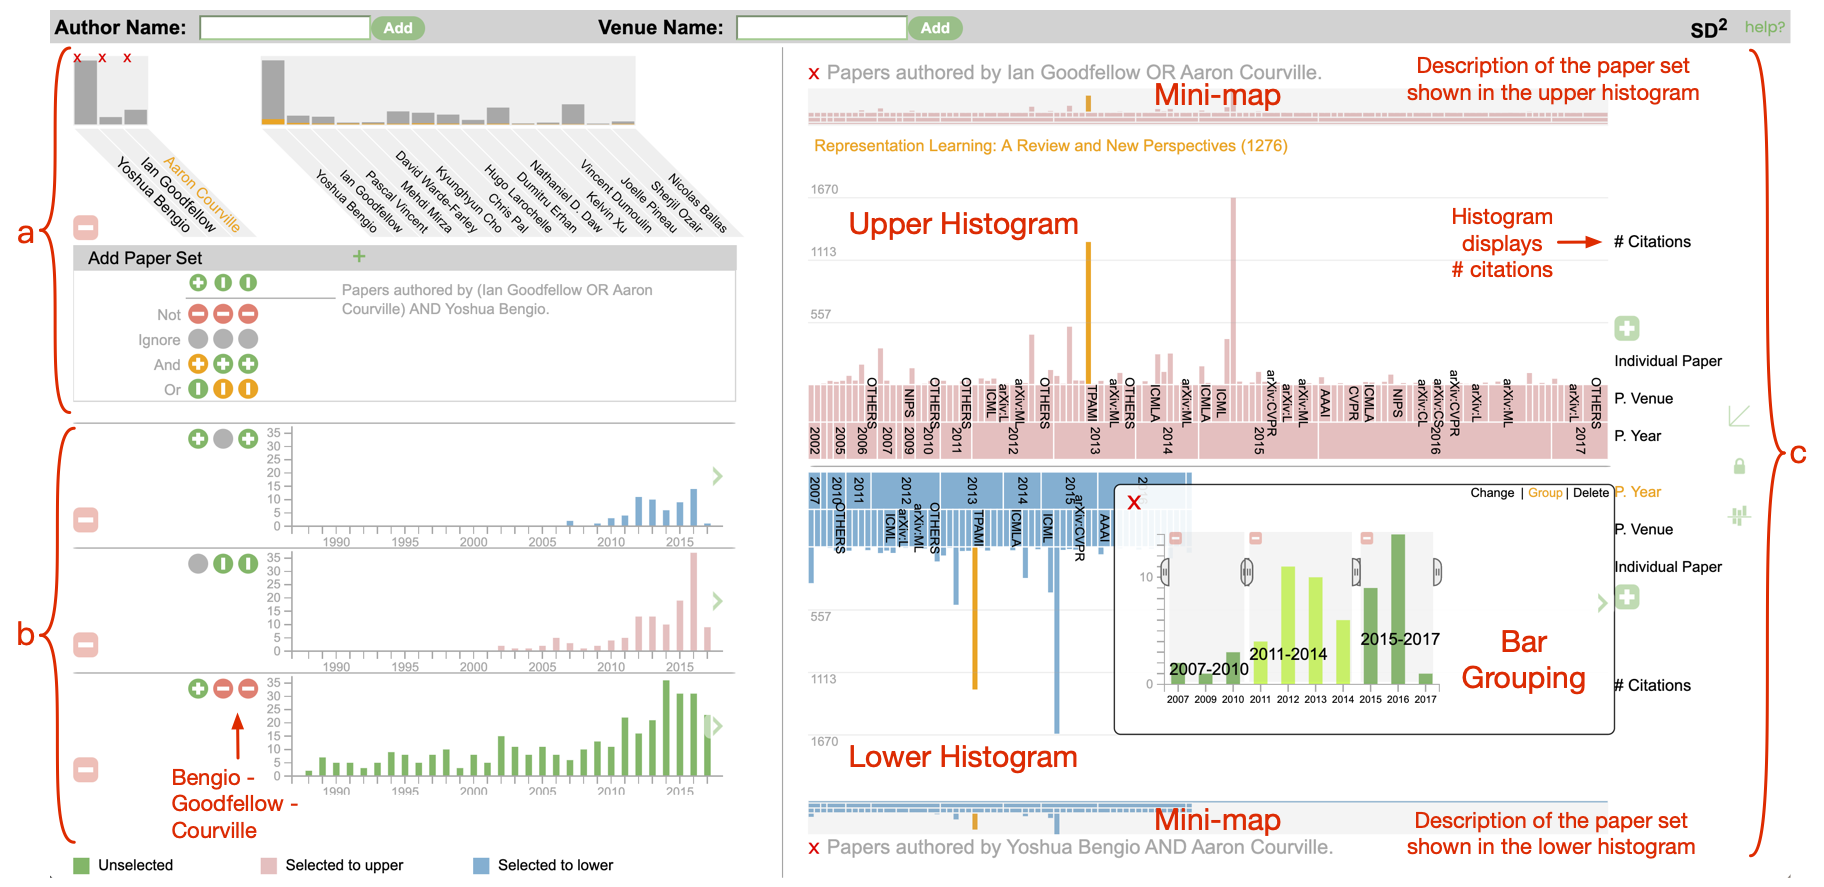
Comprehensively evaluating and comparing researchers' academic performance is complicated due to the intrinsic complexity of scholarly data. Different scholarly evaluation tasks often require the publication and citation data to be investigated in various manners. In this paper, we present an interactive visualization framework, SD^2, to enable flexible data partition and composition to support various analysis requirements within a single system. SD^2 features the hierarchical histogram, a novel visual representation for flexibly slicing and dicing the data, allowing different aspects of scholarly performance to be studied and compared. We also leverage the state-of-the-art set visualization technique to select individual researchers or combine multiple scholars for comprehensive visual comparison. We conduct multiple rounds of expert evaluation to study the effectiveness and usability of SD^2 and revise the design and system implementation accordingly. The effectiveness of SD^2 is demonstrated via multiple usage scenarios with each aiming to answer a specific, commonly raised question.