CosmoVis: An Interactive Visual Analysis Tool for Exploring Hydrodynamic Cosmological Simulations
David Abramov, Joseph N. Burchett, Oskar Elek, Cameron Hummels, J. Xavier Prochaska, Angus G. Forbes
View presentation:2022-10-21T14:12:00ZGMT-0600Change your timezone on the schedule page
2022-10-21T14:12:00Z
Prerecorded Talk
The live footage of the talk, including the Q&A, can be viewed on the session page, Spatial Data.
Fast forward
Keywords
Astrovis, astrographics, cosmological simulations, astronomy, astrophysics, virtual spectrography
Abstract
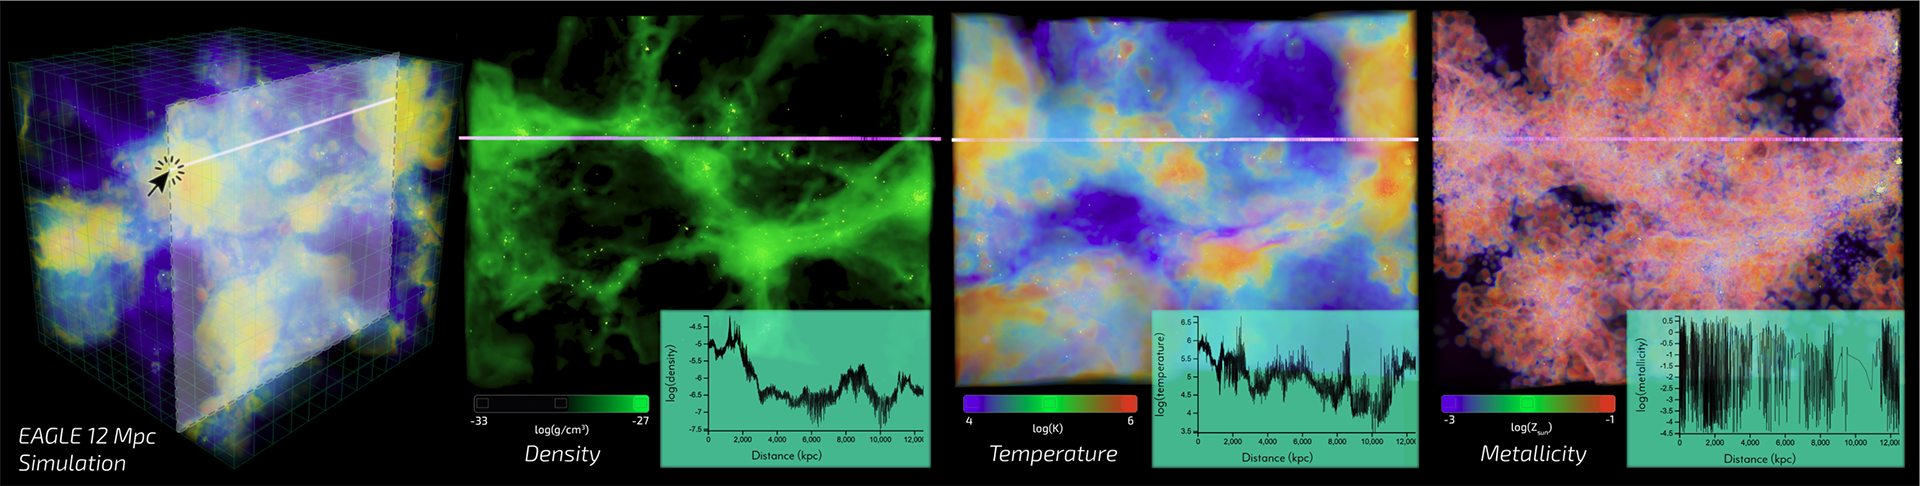
We introduce CosmoVis, an open source web-based visualization tool for the interactive analysis of massive hydrodynamic cosmological simulation data. CosmoVis was designed in close collaboration with astrophysicists to enable researchers and citizen scientists to share and explore these datasets, and to use them to investigate a range of scientific questions. CosmoVis visualizes many key gas, dark matter, and stellar attributes extracted from the source simulations, which typically consist of complex data structures multiple terabytes in size, often requiring extensive data wrangling. CosmoVis introduces a range of features to facilitate real-time analysis of these simulations, including the use of "virtual skewers," simulated analogues of absorption line spectroscopy that act as spectral probes piercing the volume of gaseous cosmic medium. We explain how such synthetic spectra can be used to gain insight into the source datasets and to make functional comparisons with observational data. Furthermore, we identify the main analysis tasks that CosmoVis enables and present implementation details of the software interface and the client-server architecture. We conclude by providing details of three contemporary scientific use cases that were conducted by domain experts using the software and by documenting expert feedback from astrophysicists at different career levels.