Who benefits from Visualization Adaptations? Towards a better Understanding of the Influence of Visualization Literacy
Marc Satkowski, Franziska Kessler, Susanne Narciss, Raimund Dachselt
View presentation:2022-10-20T14:09:00ZGMT-0600Change your timezone on the schedule page
2022-10-20T14:09:00Z
Prerecorded Talk
The live footage of the talk, including the Q&A, can be viewed on the session page, Personal Visualization, Theory, Evaluation, and eXtended Reality.
Fast forward
Keywords
User Study; Visualization Adaptation; Visualization Literacy; Visualization Competence; Information Visualization; Online Survey; User Experience
Abstract
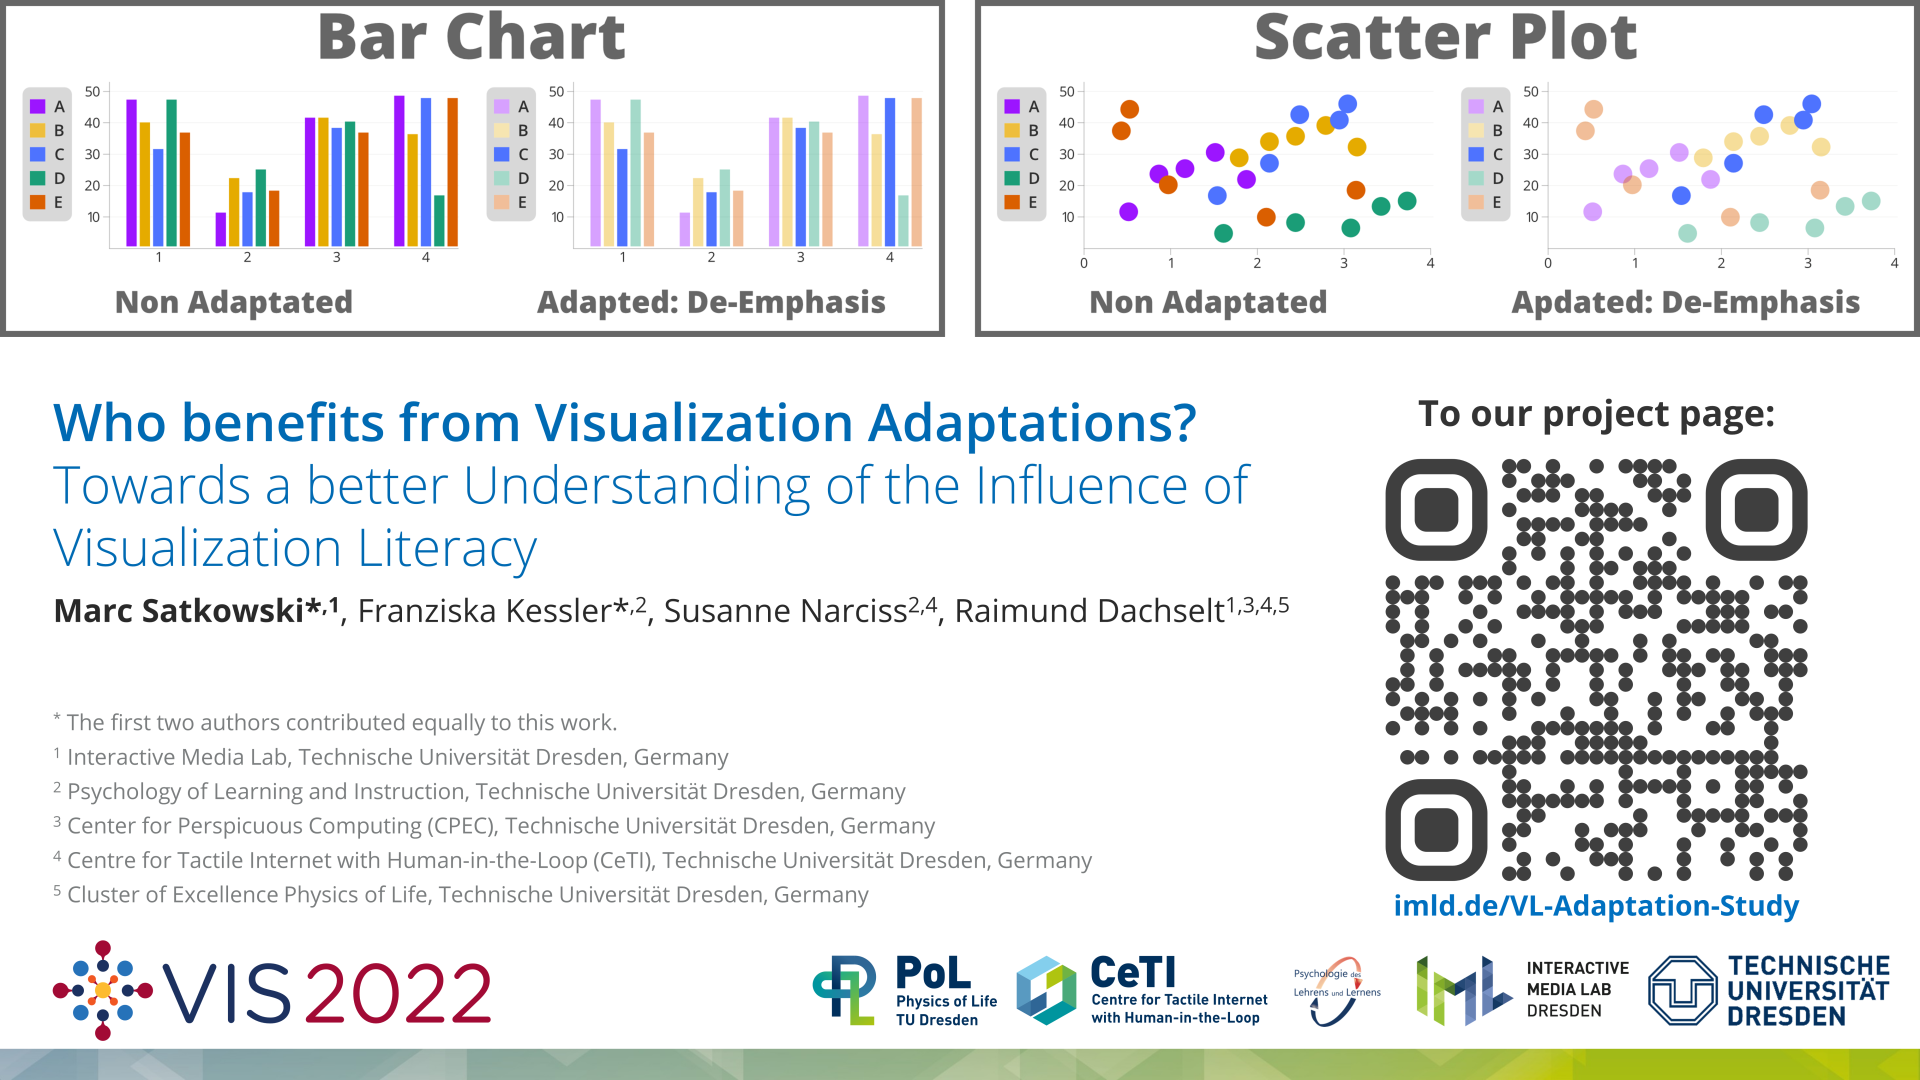
The ability to read, understand, and comprehend visual information representations is subsumed under the term visualization literacy (VL). One possibility to improve the use of information visualizations is to introduce adaptations. However, it is yet unclear whether people with different VL benefit from adaptations to the same degree. We conducted an online experiment (n = 42) to investigate whether the effect of an adaptation (here: De-Emphasis) of visualizations (bar charts, scatter plots) on performance (accuracy, time) and user experiences depends on users’ VL level. Using linear mixed models for the analyses, we found a positive impact of the De-Emphasis adaptation across all conditions, as well as an interaction effect of adaptation and VL on the task completion time for bar charts. This work contributes to a better understanding of the intertwined relationship of VL and visual adaptations and motivates future research.