On-Tube Attribute Visualization for Multivariate Trajectory Data
Benjamin Russig, David Groß, Raimund Dachselt, Stefan Gumhold
View presentation:2022-10-21T15:00:00ZGMT-0600Change your timezone on the schedule page
2022-10-21T15:00:00Z
Prerecorded Talk
The live footage of the talk, including the Q&A, can be viewed on the session page, Spatial Data.
Fast forward
Abstract
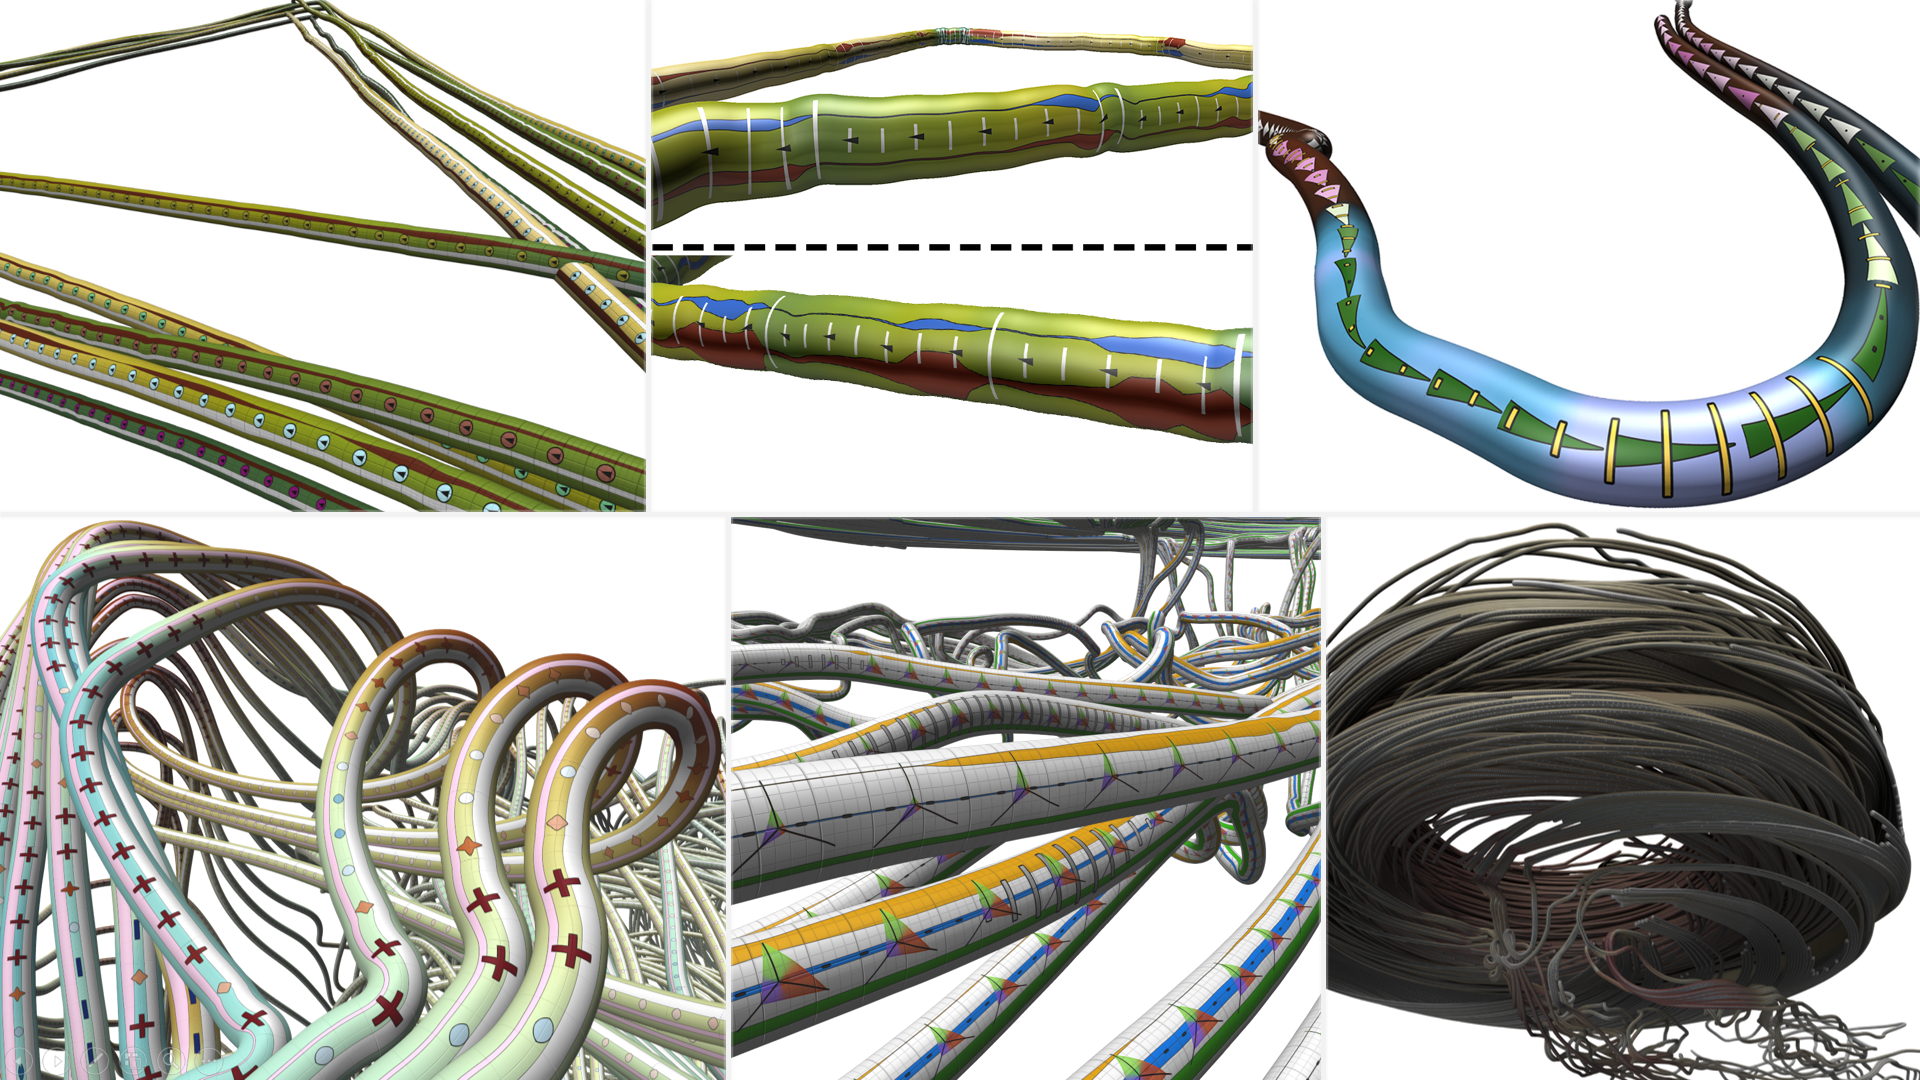
Stylized tubes are an established visualization primitive for line data as encountered in many scientific fields, ranging from characteristic lines in flow fields, fiber tracks reconstructed from diffusion tensor imaging, to trajectories of moving objects as they arise from cyber-physical systems in many engineering disciplines. Typical challenges include large data set sizes demanding for efficient rendering techniques as well as a large number of attributes that cannot be mapped simultaneously to the basic visual attributes provided by a tube-based visualization. In this work, we tackle both challenges with a new on-tube visualization approach. We improve recent work on high-quality GPU ray casting of Hermite spline tubes supporting ambient occlusion and extend it by a new layered procedural texturing technique. In the proposed framework, a large number of data set attributes can be mapped simultaneously to a variety of glyphs and plots that are embedded in texture space and organized in layers. Efficient rendering with minimal data transfer is achieved by generating the glyphs procedurally and drawing them in a deferred shading pass. We integrated these techniques in a prototype visualization tool that facilitates flexible mapping of data set attributes to visual tube and glyph attributes. We studied our approach on a variety of example data from different fields and found it to provide a highly adaptable and extensible toolbox to quickly craft tailor-made tube-based trajectory visualizations.