TacticFlow: Visual Analytics of Ever-Changing Tactics in Racket Sports
Jiang Wu, Dongyu Liu, Ziyang Guo, Qingyang Xu, Yingcai Wu
External link (DOI)
View presentation:2021-10-28T13:15:00ZGMT-0600Change your timezone on the schedule page
2021-10-28T13:15:00Z
Abstract
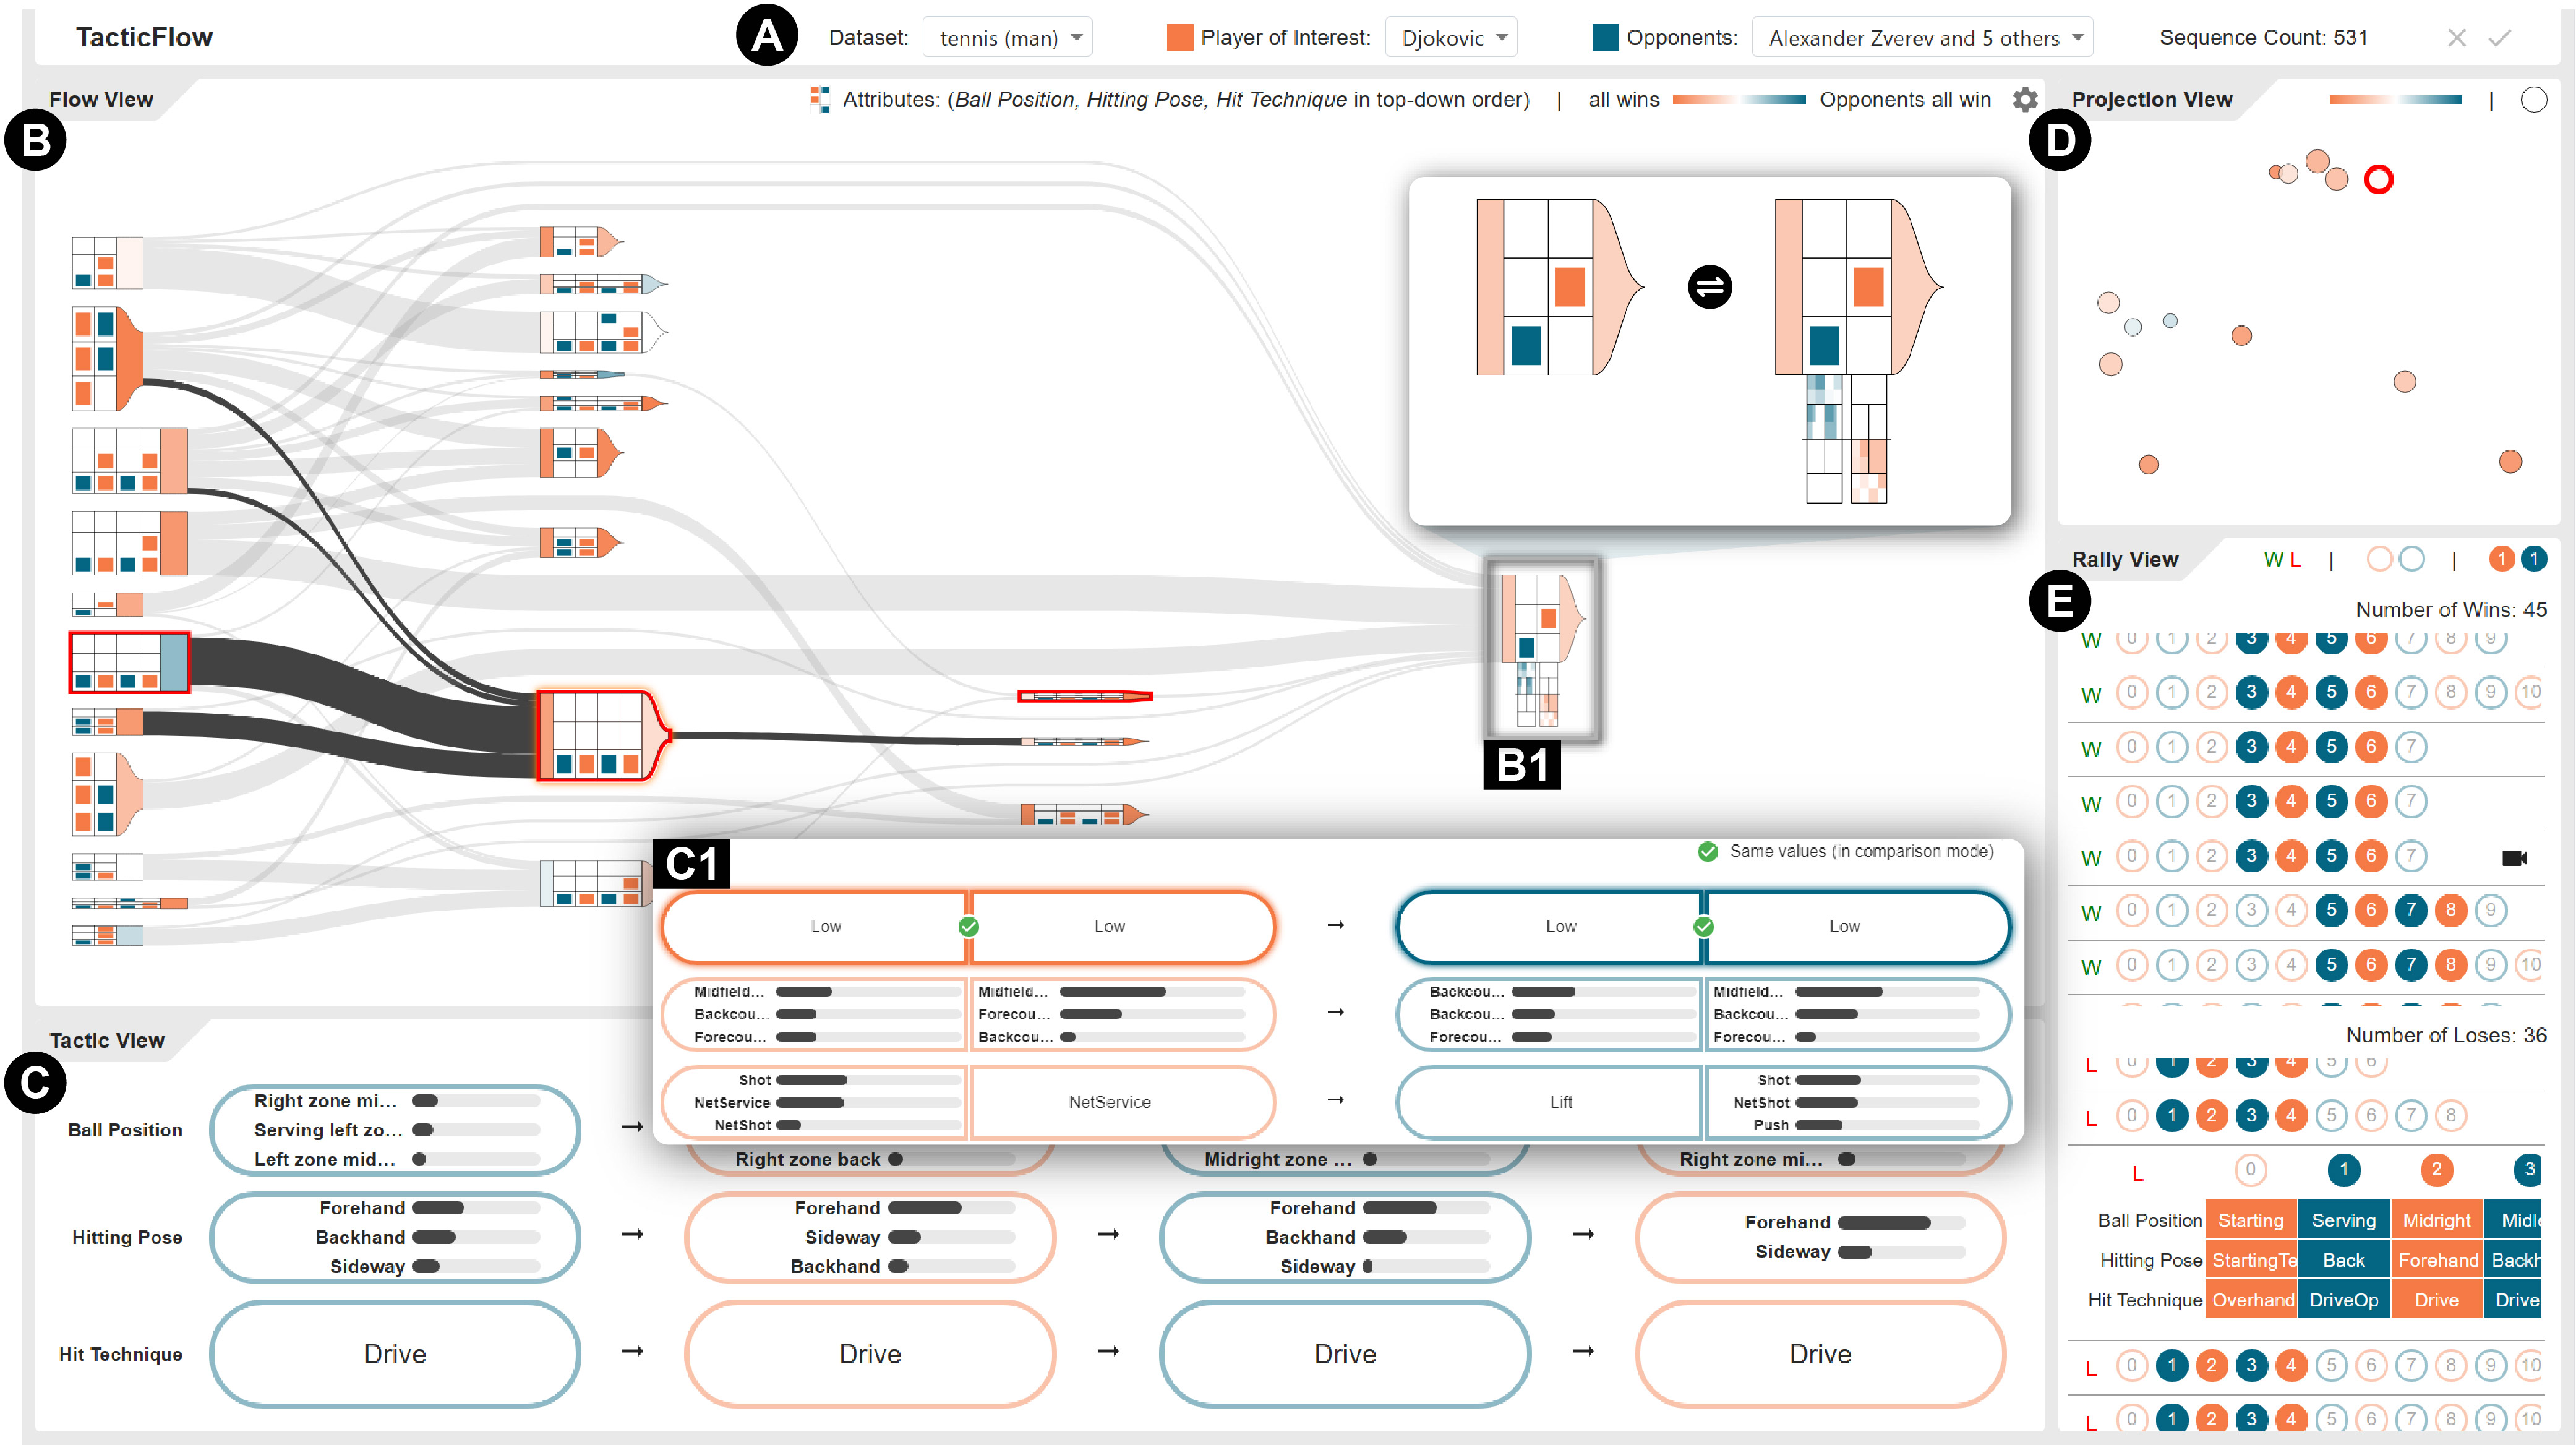
Event sequence mining is often used to summarize patterns from hundreds of sequences but faces special challenges when handling racket sports data. In racket sports (e.g., tennis and badminton), a player hitting the ball is considered a multivariate event consisting of multiple attributes (e.g., hit technique and ball position). A rally (i.e., a series of consecutive hits beginning with one player serving the ball and ending with one player winning a point) thereby can be viewed as a multivariate event sequence. Mining frequent patterns and depicting how patterns change over time is instructive and meaningful to players who want to learn more short-term competitive strategies (i.e., tactics) that encompass multiple hits. However, players in racket sports usually change their tactics rapidly according to the opponent’s reaction, resulting in ever-changing tactic progression. In this work, we introduce a tailored visualization system built on a novel multivariate sequence pattern mining algorithm to facilitate explorative identification and analysis of various tactics and tactic progression. The algorithm can mine multiple non-overlapping multivariate patterns from hundreds of sequences effectively. Based on the mined results, we propose a glyph-based Sankey diagram to visualize the ever-changing tactic progression and support interactive data exploration. Through two case studies with four domain experts in tennis and badminton, we demonstrate that our system can effectively obtain insights about tactic progression in most racket sports. We further discuss the strengths and the limitations of our system based on domain experts’ feedback.