Supporting Guided Exploratory Visual Analysis on Time Series Data with Reinforcement Learning
Yang Shi, Bingchang Chen, Ying Chen, Zhuochen Jin, Ke Xu, Xiaohan Jiao, Tian Gao, Nan Cao
DOI: 10.1109/TVCG.2023.3327200
Room: 104
2023-10-26T05:21:00ZGMT-0600Change your timezone on the schedule page
2023-10-26T05:21:00Z

Fast forward
Full Video
Keywords
Time Series Data, Exploratory Visual Analysis, Reinforcement Learning
Abstract
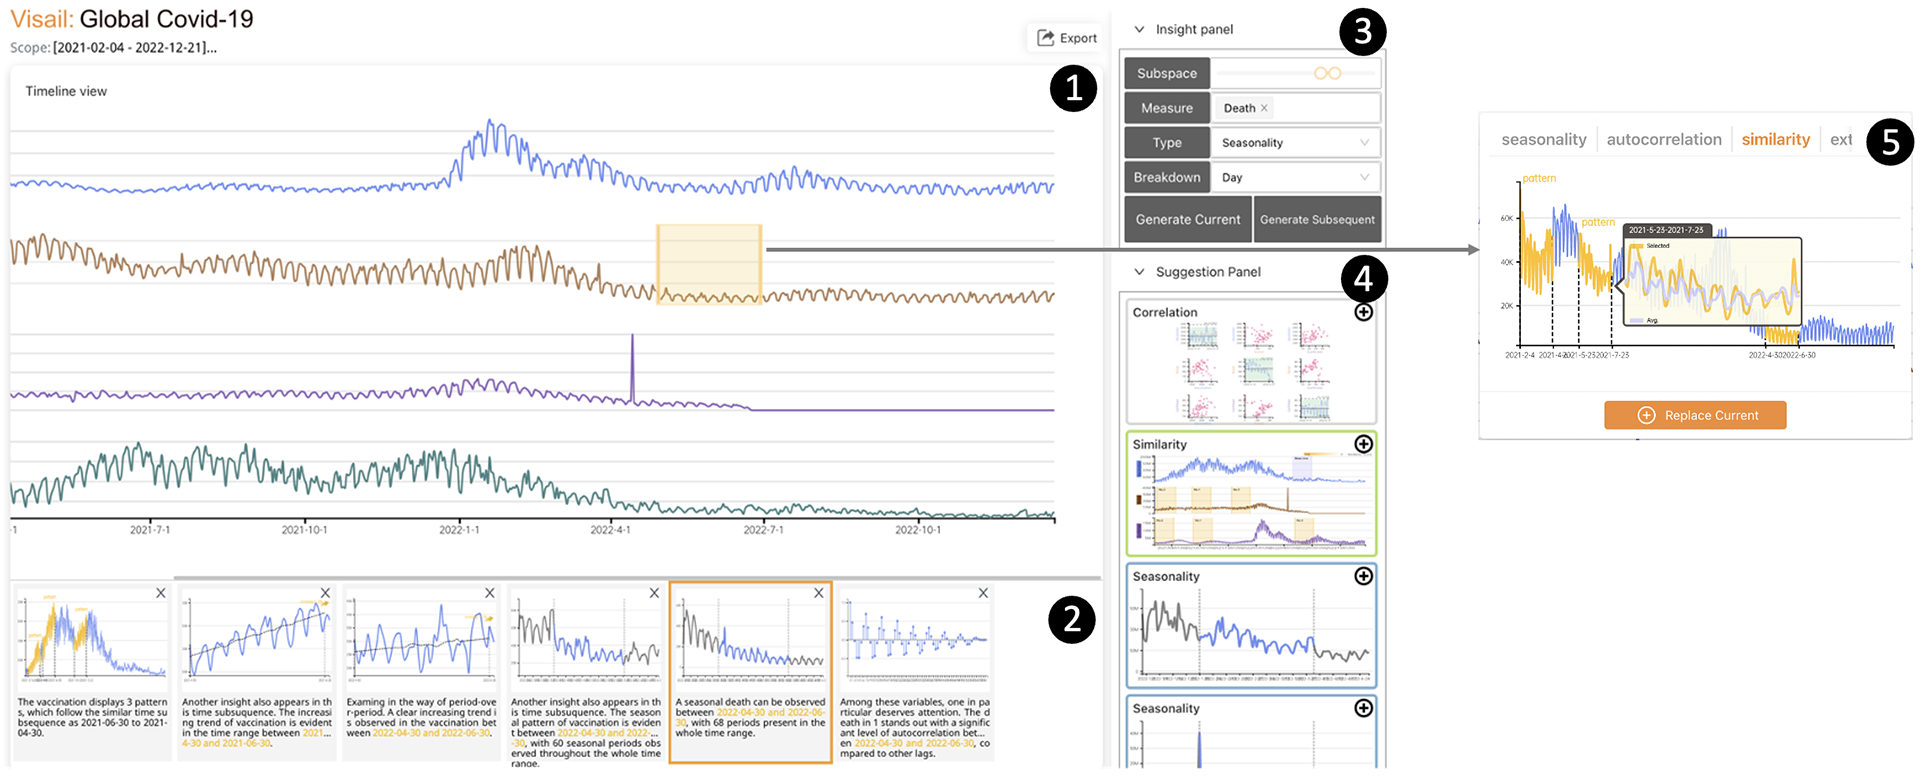
The exploratory visual analysis (EVA) of time series data uses visualization as the main output medium and input interface for exploring new data. However, for users who lack visual analysis expertise, interpreting and manipulating EVA can be challenging. Thus, providing guidance on EVA is necessary and two relevant questions need to be answered. First, how to recommend interesting insights to provide a first glance at data and help develop an exploration goal. Second, how to provide step-by-step EVA suggestions to help identify which parts of the data to explore. In this work, we present a reinforcement learning (RL)-based system, Visail, which generates EVA sequences to guide the exploration of time series data. As a user uploads a time series dataset, Visail can generate step-by-step EVA suggestions, while each step is visualized as an annotated chart combined with textual descriptions. The RL-based algorithm uses exploratory data analysis knowledge to construct the state and action spaces for the agent to imitate human analysis behaviors in data exploration tasks. In this way, the agent learns the strategy of generating coherent EVA sequences through a well-designed network. To evaluate the effectiveness of our system, we conducted an ablation study, a user study, and two case studies. The results of our evaluation suggested that Visail can provide effective guidance on supporting EVA on time series data.